
The Standards Behind the Practice: RFC 2544, TWAMP, and Traceroute

Synthetic Monitoring Series — Part 5 of 9
The Standards Behind the Practice: RFC 2544, TWAMP, and Traceroute
When two engineers measure “throughput,” they need to agree on what that word means. The RFCs covered in this post gave the industry that common language — and transformed manual diagnostic commands into the foundation of modern automated testing.
This is the more technical post in the series, and deliberately so. Understanding the standards behind synthetic monitoring is what separates engineers who use these tools from engineers who understand them. The latter group debugs faster, configures more precisely, and trusts their results more completely.
Start Here: What the Videos Cover
▶ Video 10 — “RFC 2544 — How We Standardized Performance Testing”
▶ Video 11 — “TWAMP — Two-Way Active Measurement Protocol”

▶ Video 12 — “From Manual Tools to Scheduled Monitoring — The Evolution of Standards”
RFC 2544 Standardizing Network Performance Testing
Published in 1999, RFC 2544 solved a problem that was frustrating network engineers everywhere: two vendors could both claim “line-rate forwarding” for their equipment, but measure it completely differently. RFC 2544 defined the methodology that made those claims comparable.
The three core test types
Test | What It Measures | Why It Matters |
|---|---|---|
Throughput | Maximum packet rate with zero frame loss | Actual forwarding capacity — not the number on the spec sheet |
Latency | Transit delay through a device — first bit in to last bit out | How long packets spend inside the device, independent of path |
Frame Loss Rate | Percentage of frames not forwarded at each tested rate | Where the device’s capacity curve breaks |
The throughput test is the most important to understand correctly. It sends packets at increasing rates until the device starts dropping them. The maximum rate with zero loss is your throughput — not the theoretical bandwidth, not the interface speed. Actual, measured, zero-loss forwarding capacity.
RFC 2544 in production networks today
A 1999 RFC might sound like history, but the methodology is directly applicable to modern network monitoring. When you run a probe-to-probe throughput test between your New York and London offices, you are applying RFC 2544 methodology to a real network path rather than a lab device. Same principles. Same rigor. Real-world conditions instead of controlled lab environments.
The methodology doesn’t care whether you’re testing a router in a lab or a WAN link between continents. The physics of packet forwarding are the same. That’s what makes 25-year-old methodology still the standard for performance testing.
RFC 5357 TWAMP: Measuring the Round Trip, Both Ways
RFC 2544 was designed for lab environments — controlled, one-directional tests between dedicated test equipment. It was never meant for production networks where traffic flows in both directions simultaneously and measurement can’t interrupt service.
TWAMP — the Two-Way Active Measurement Protocol, defined in RFC 5357 — fills that gap. It measures packet loss, latency, and jitter on live network paths without taking the link down or requiring dedicated test windows.
How TWAMP works
TWAMP uses a client-server architecture with two roles: the Control-Client coordinates the test session, and the Session-Reflector echoes test packets back with precise timestamps. Because both the outbound and return paths are measured independently, TWAMP can detect asymmetric routing — where traffic takes a different path in each direction — and measure the latency contribution of each direction separately.
Measurement | RFC 2544 | TWAMP |
|---|---|---|
Environment | Lab / controlled | Live production networks |
Directionality | One-way | Bidirectional, independently measured |
Traffic impact | Disruptive — requires test window | Non-disruptive — runs alongside live traffic |
Asymmetric routing detection | No | Yes |
Continuous operation | No | Yes |
For ongoing synthetic monitoring of production WAN links and cloud interconnects, TWAMP is the right tool. RFC 2544 is for characterizing capacity. TWAMP is for continuously validating that capacity is being delivered.
1983→Now Traceroute: From Diagnostic Tool to Monitoring Signal
Traceroute works by exploiting the TTL field in IP packets. Every router that forwards a packet decrements the TTL by one. When TTL reaches zero, the router discards the packet and sends back an ICMP Time Exceeded message — which reveals its identity and its latency contribution.
By sending probes with TTL values of 1, 2, 3, and so on, traceroute peels back the network path one hop at a time: TTL 1 reaches the first router, TTL 2 reaches the second, TTL 3 reaches the third. Each response adds one more hop to the visible path.
Two important caveats
Routers can rate-limit ICMP responses, making certain hops appear slower than they actually are. A high RTT at one hop doesn’t always mean that hop is the problem — it may mean that router deprioritizes ICMP while forwarding application traffic normally.
The return path may also differ from the forward path. Asymmetric routing means per-hop RTT isn’t purely additive, and a slow-looking hop may be caused by the return route, not the forward route.
Path hashing: turning traceroute into a monitoring signal
Modern monitoring platforms don’t just run traceroute once — they run it continuously and hash the entire hop sequence using SHA-256. If any router in the path changes, the hash changes. Route change detected automatically, without manually comparing individual hops or needing an engineer to notice.
This transforms traceroute from a reactive diagnostic command into a proactive monitoring signal. Run it once: diagnostic tool. Run it continuously: early warning system for routing changes, BGP shifts, and ISP path instability.
The Arc: From Manual to Automated
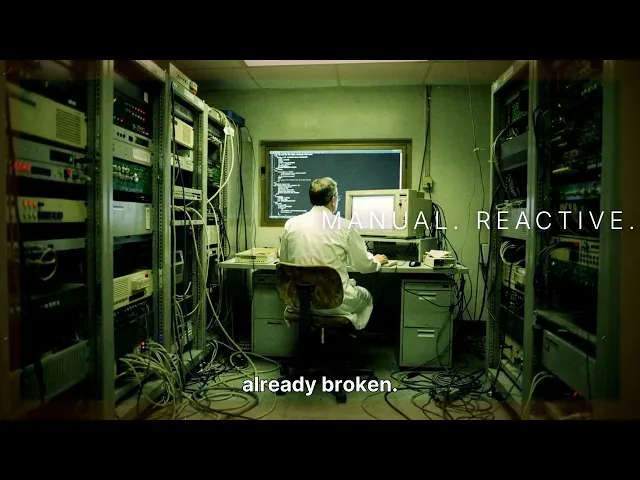
Each of these standards formalized something engineers were already doing manually. The pattern repeats across the entire history of network monitoring.
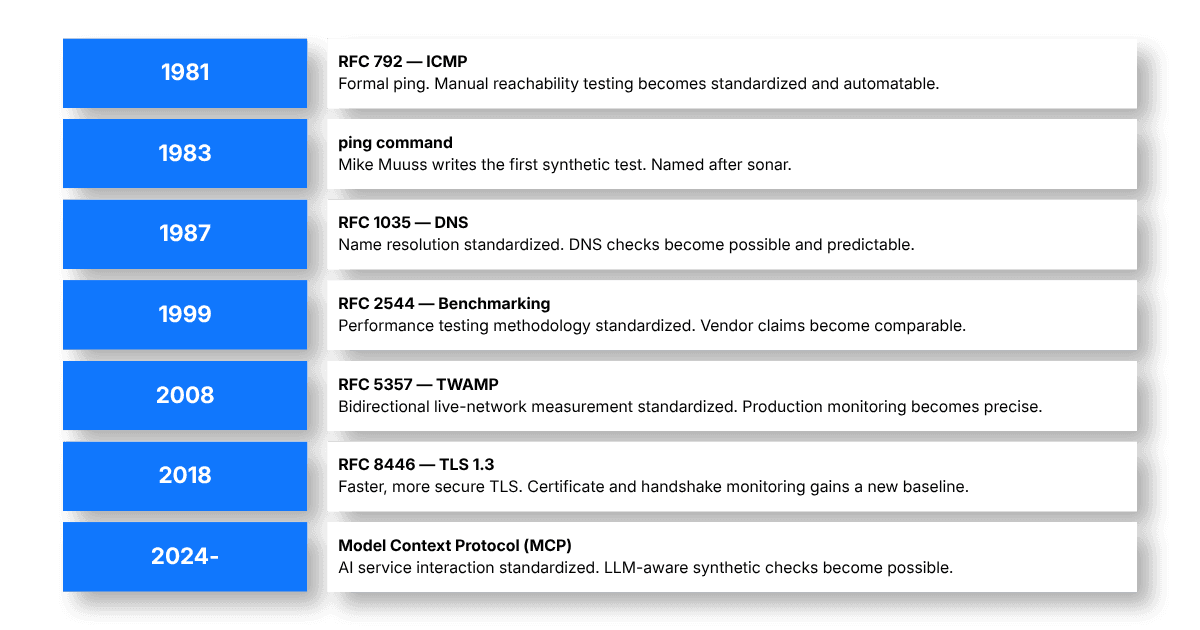
Modern synthetic monitoring isn’t a new invention. It’s forty years of manual expertise, standardized by RFCs, automated by software, and deployed worldwide. Each standard did the same thing: took a measurement that required a skilled engineer and a terminal, and made it repeatable, comparable, and schedulable.
Next in the Series
Part 6 — The Philosophy of Active Measurement. Why synthetic monitoring asks the network questions instead of waiting for answers — and how check intervals, probe placement, and the active/passive tradeoff fit together.
RFC 2544TWAMPTracerouteNetwork Performance TestingSynthetic MonitoringNetwork StandardsNetwork ObservabilitySRE
About Parlon
Parlon is an infrastructure observability platform built for enterprise teams operating complex, hybrid environments. Parlon combines active synthetic validation, real-time telemetry normalization, and learning-based alerting into a single platform — shifting operations from firefighting to foresight. Learn more at parlon.io.